やりたいこと
food_combinationという中間テーブルから、mainテーブルのnameとsugarをグラフとして表示させたい。
schema.rb
  create_table "mains", options: "ENGINE=InnoDB DEFAULT CHARSET=utf8mb4", force: :cascade do |t|
    t.string "name"
    t.string "image"
    t.integer "genre", default: 0, null: false
    t.integer "calorie"
    t.float "sugar"
    t.float "lipid"
    t.float "salt"
    t.datetime "created_at", precision: 6, null: false
    t.datetime "updated_at", precision: 6, null: false
  end
view
<% @foods.each do |food| %>
  <div class="food_graph">
      <% chart = [
      { data: food.where(id :food.main_id).pluck(:name, :sugar) }
      ] %>
     <%= bar_chart chart, colors: ["#185ADB", "#666"], min: 0, max: 100 %>
  </div>
<% end %>
調査
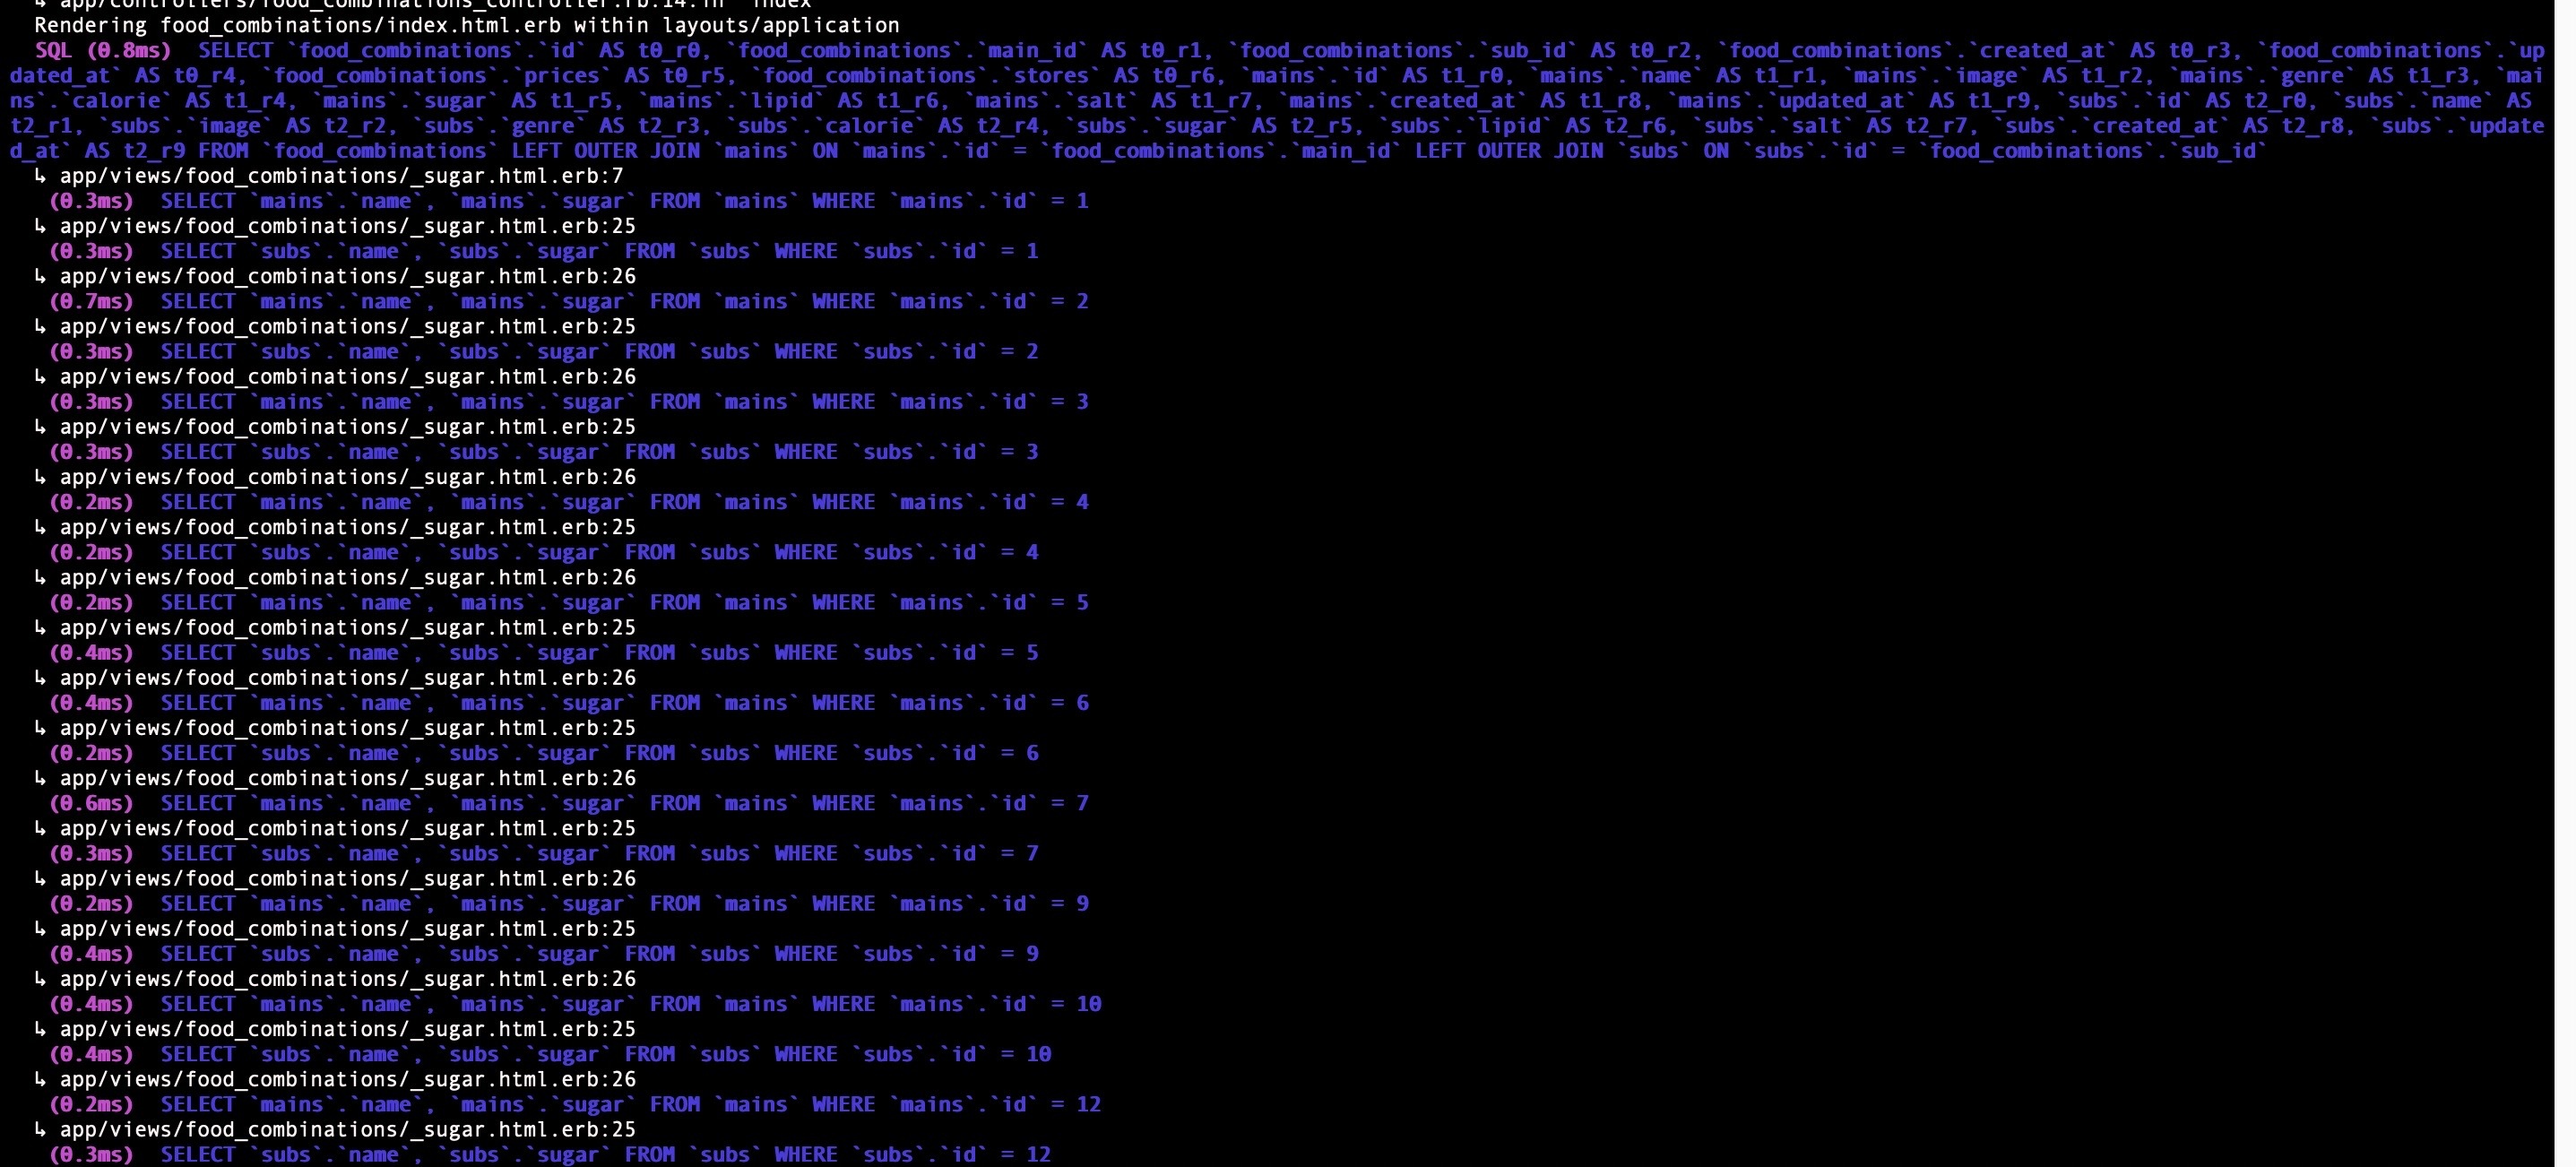
原因
- そもそもeachの中でwhereやpluckメソッドを使っているので、要素毎にSQL接続してしまっている。
解決
food_combination.rb
  def get_sugar
    { '組み合わせ成分値': sprintf("%.1f", main.sugar + sub.sugar) }
  end
view
<% @foods.each do |food| %>
     <div class="food_graph">
         <% chart = [
          { name: '糖質(g)', data: food.get_sugar }
          ] %>
         <%= bar_chart chart, colors: ["#185ADB", "#666"], min: 0, max: 100 %>
     </div>
<% end %>